Tutorial 2- Run Python in a Container
In this tutorial, you'll learn how to run Python code in container metaframes. One of the powerful features of Metapages is the ability to execute code directly in the browser using containerized environments. You'll write Python code that generates data visualization and display the results.
Introduction to Container Metaframes
Container metaframes enable you to:
- Write and execute Python scripts or code snippets
- Define your own Docker images
- Automatically build images from Git repositories
- Publish and share your tools with others
Creating a Python-Powered Metapage
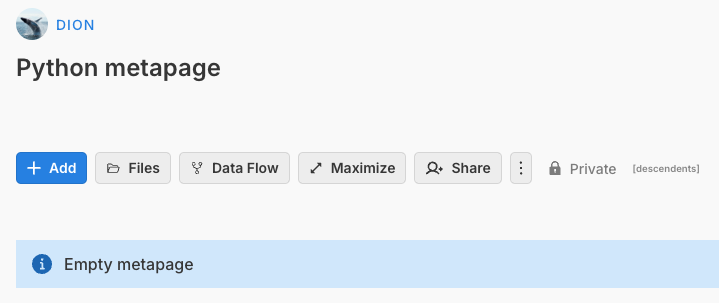
Step 1: Create a New Metapage
From the metapage.io homepage:
- Click the
+ Newbutton - Give your metapage a name (we'll use "Python metapage")
Step 2: Add a Python Visualization Metaframe
- Click the "+ Add" button
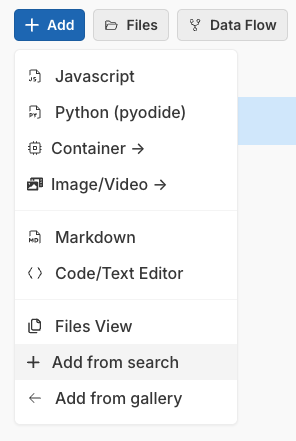
- Select "Add from search"
- Search for "matplotlib"
- Select the matplotlib metaframe
- Click the "+ Add" button to add it to your page
The matplotlib metaframe should now appear on your metapage.
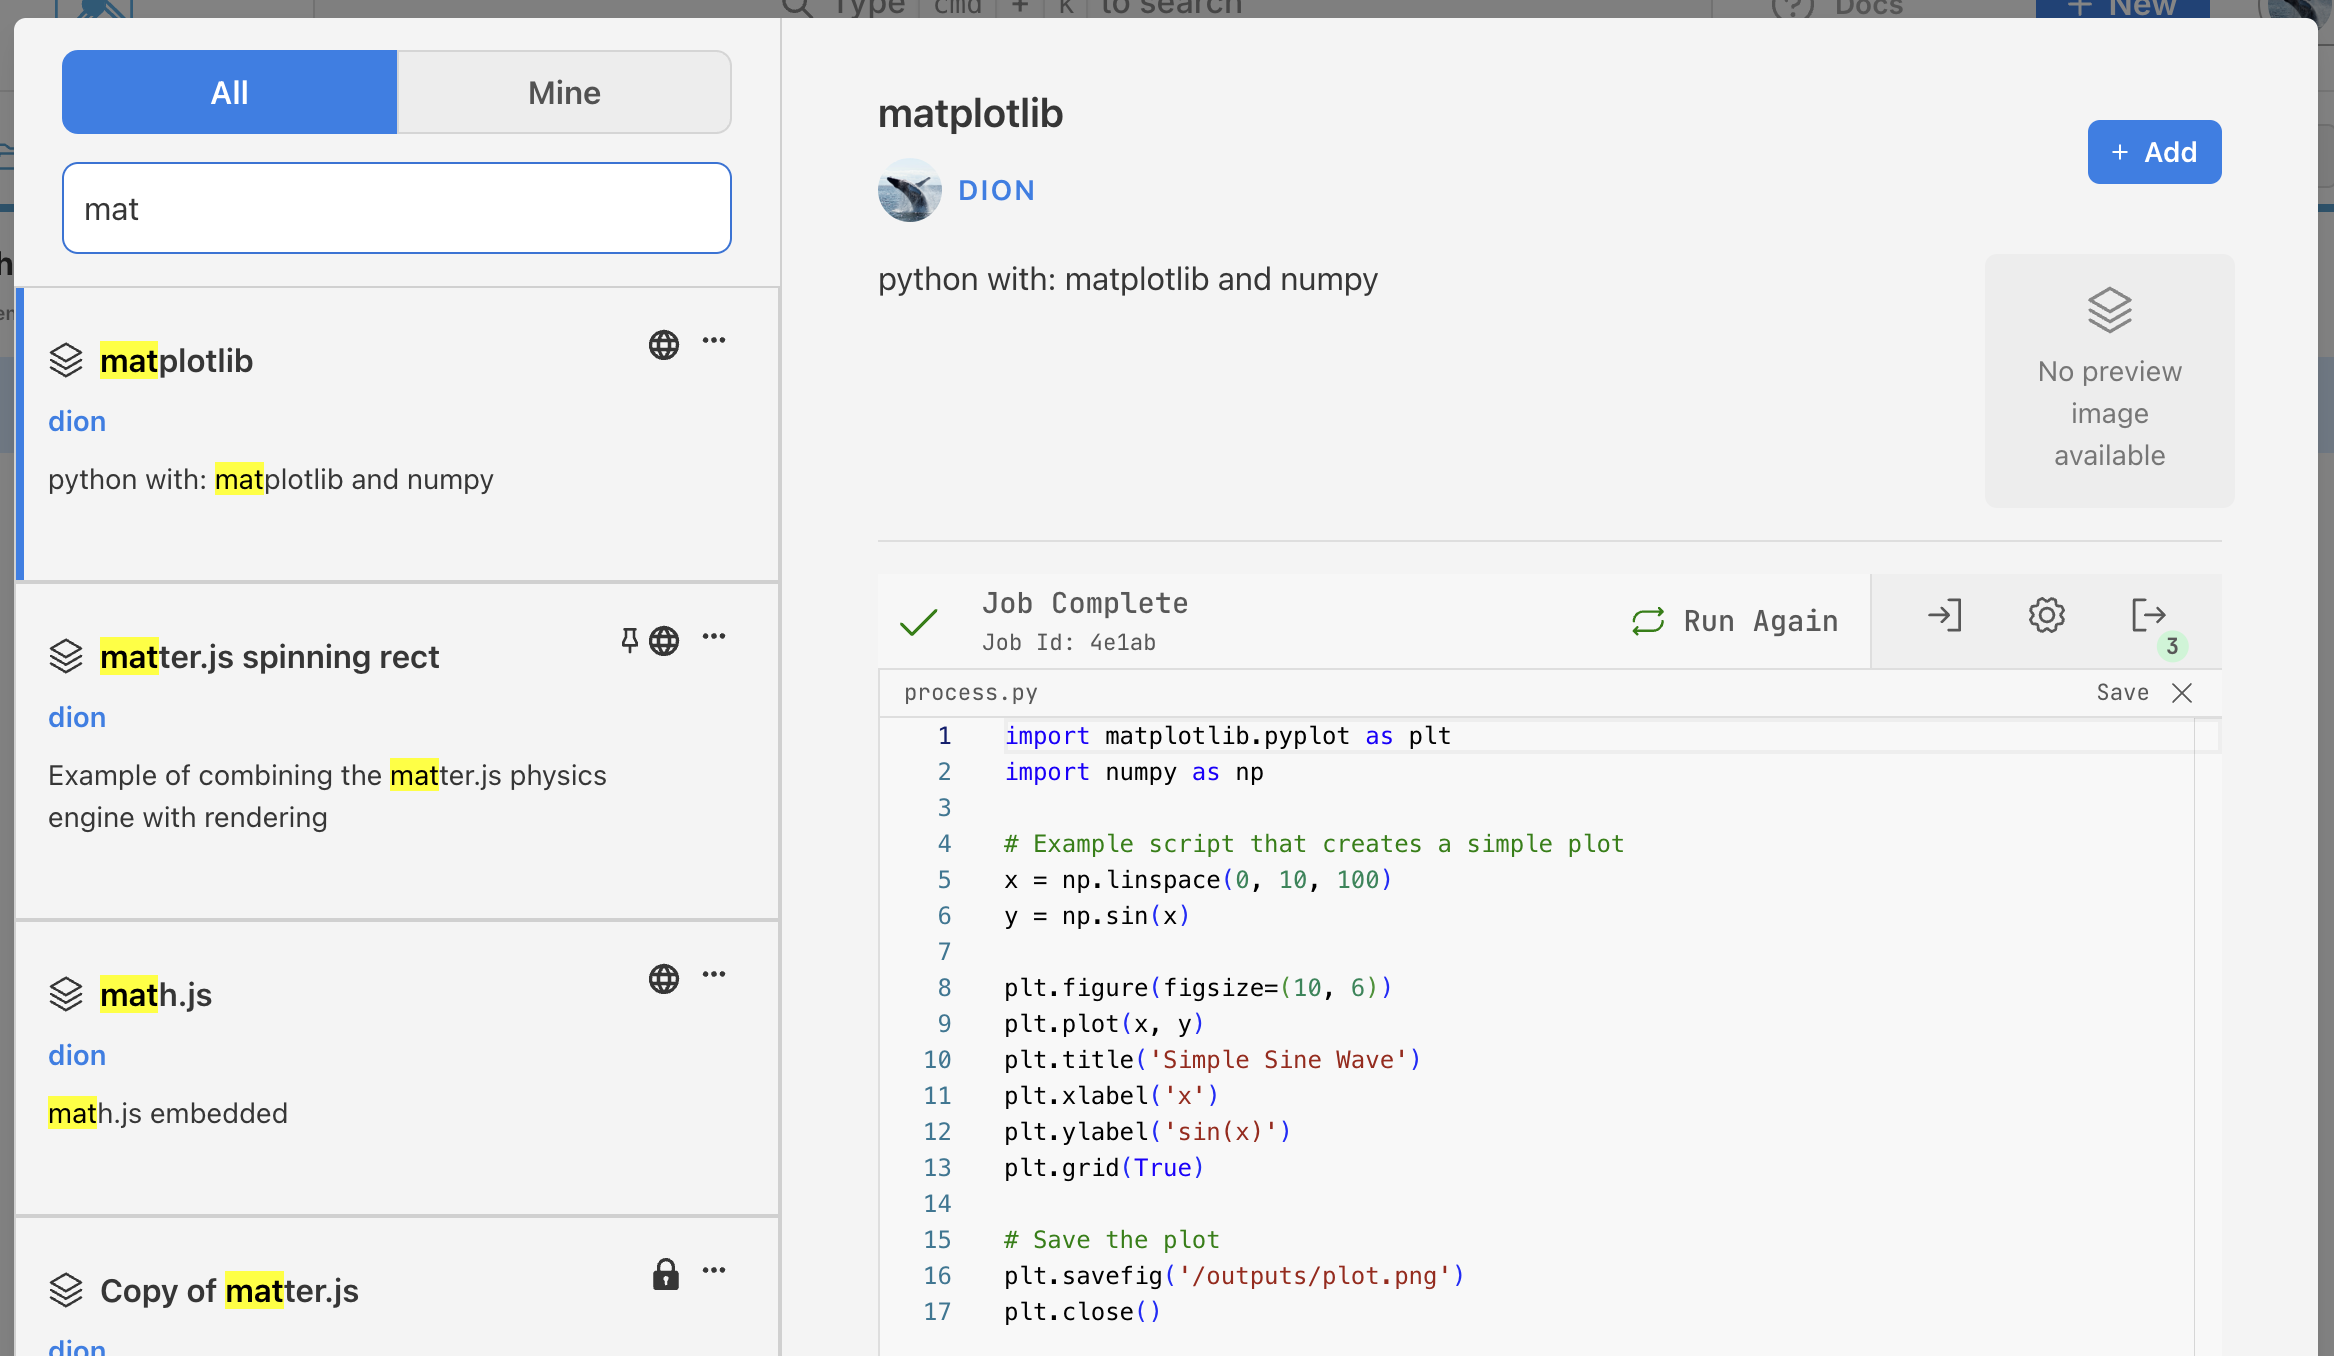
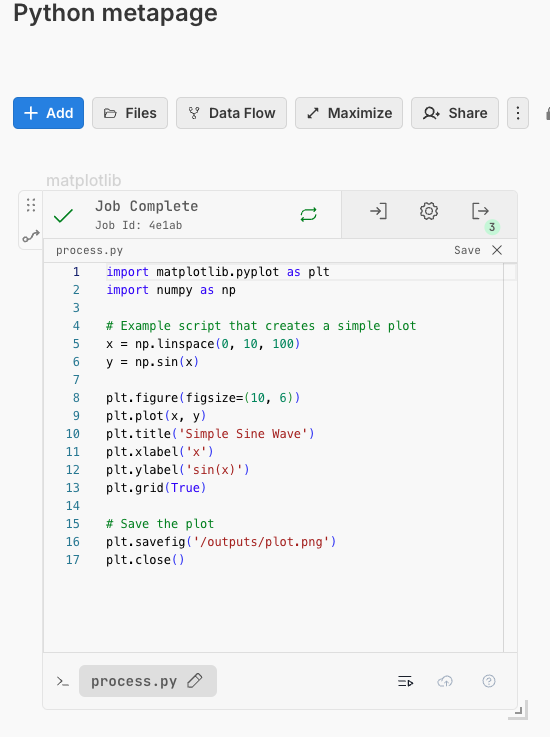
Step 3: Examine the Default Code
You should see Python code for plotting a matplotlib image in the editor. Don't worry that no image appears yet — we'll get to that soon.
Step 4: Edit the Python Code
Let's modify the code to generate some noisy data and create a plot. Copy the following code into the editor of the matplotlib metaframe:
import matplotlib.pyplot as plt
import numpy as np
# Generate data from a y=x line with noise
x_line = np.linspace(0, 1, 20)
y_line = x_line + np.random.normal(scale=0.1, size=x_line.shape)
#print(x_line, y_line)
# Create a scatter plot for the y=x line with noise
plt.figure(figsize=(10, 6))
plt.scatter(x_line, y_line, color='blue')
# Add labels and title
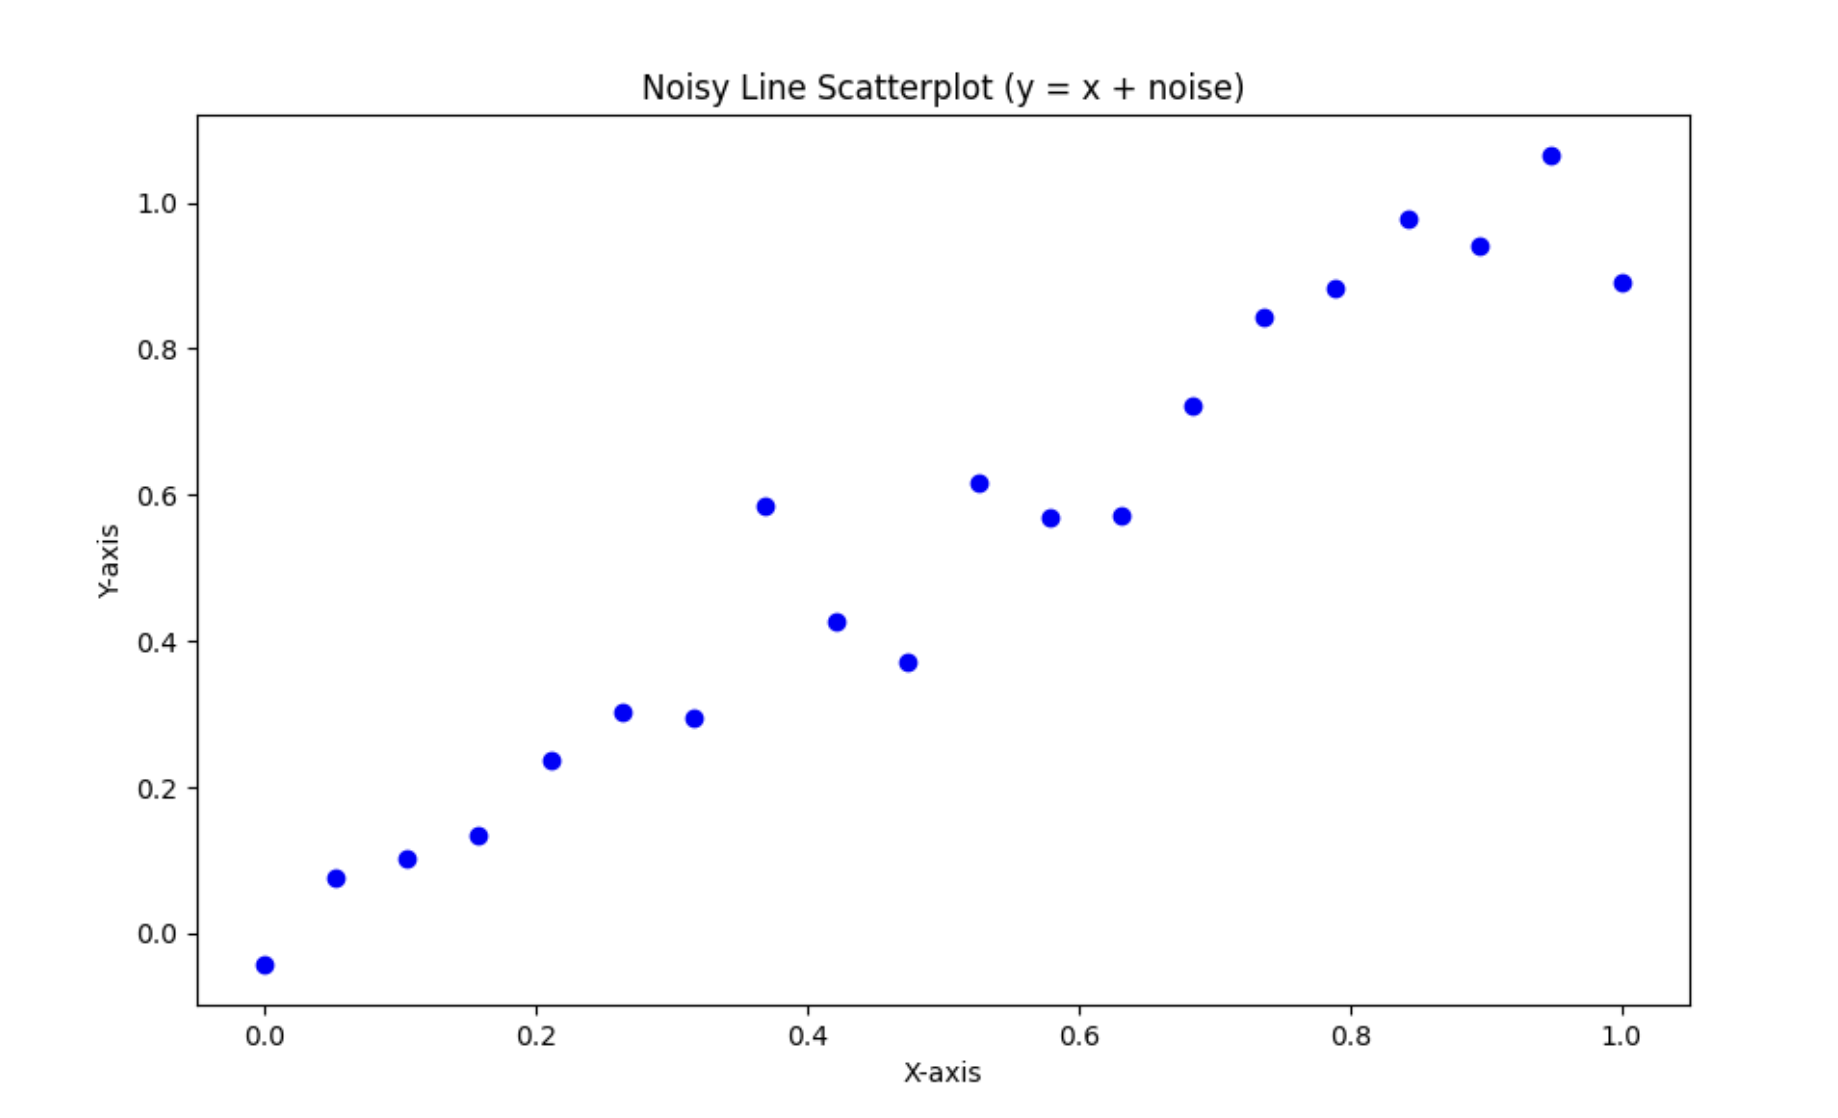
plt.title("Noisy Line Scatterplot (y = x + noise)")
plt.xlabel("X-axis")
plt.ylabel("Y-axis")
plt.savefig('/outputs/plot.png')
print("Sent plot.png!")
# Close the current active figure
plt.close()
This code:
- Generates data points along a y=x line with random noise
- Creates a scatter plot of these points
- Saves the plot as an image file
- Maps the generated image to the metaframe's output
Step 5: Run the Code
After pasting the code, execute it by clicking Run Job or Run Again to generate the plot.
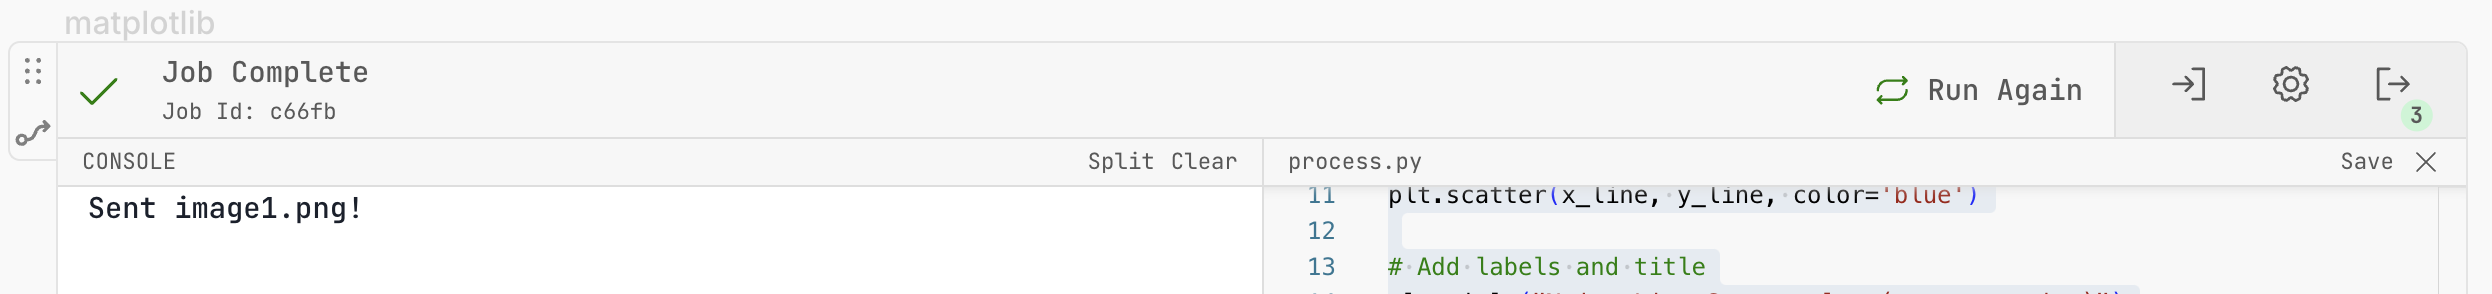
Step 6: Verify the Execution
If the code runs correctly, you should see:
- ✅ Job complete
- A 3 in green at the top right indicating three output files were generated
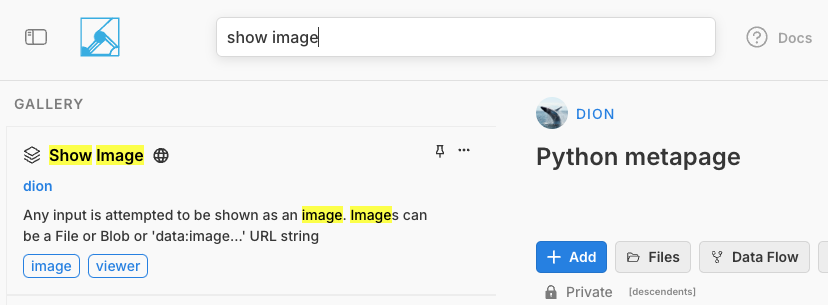
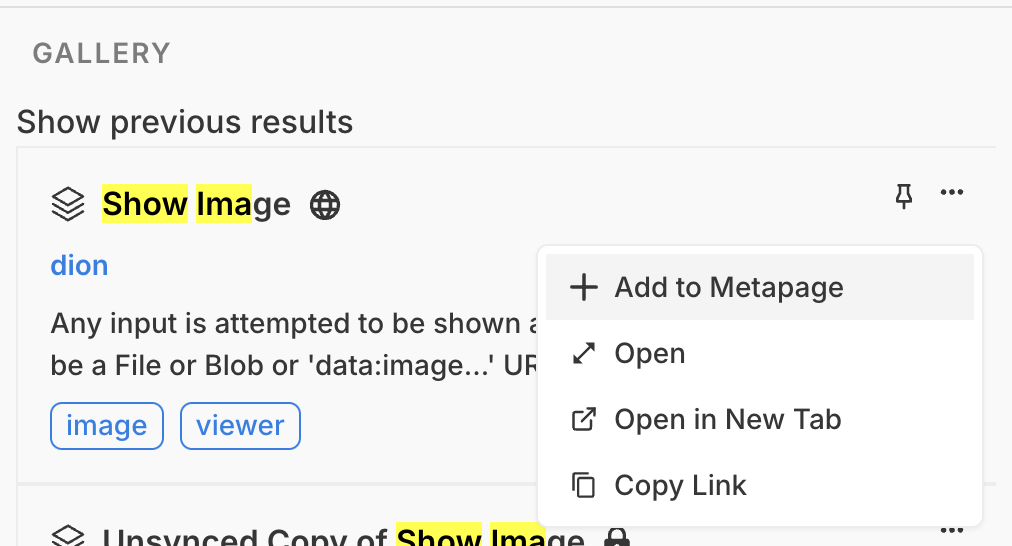
Step 7: Add an Image Viewer
To view the generated plot, we need to add a "Show Image" metaframe:
Use the search bar to find the "Show Image" metaframe

Add it using the "+ Add to Metapage" option from the dropdown
Resize the metaframe to fit better in your workspace
Note: You can also add this metaframe using the “+ Add” button on the top right.
Step 8: Create a Data Connection
Now let's connect the Python output to the image viewer:
- Click on the "Data Flow" button on the "Show Image" metaframe
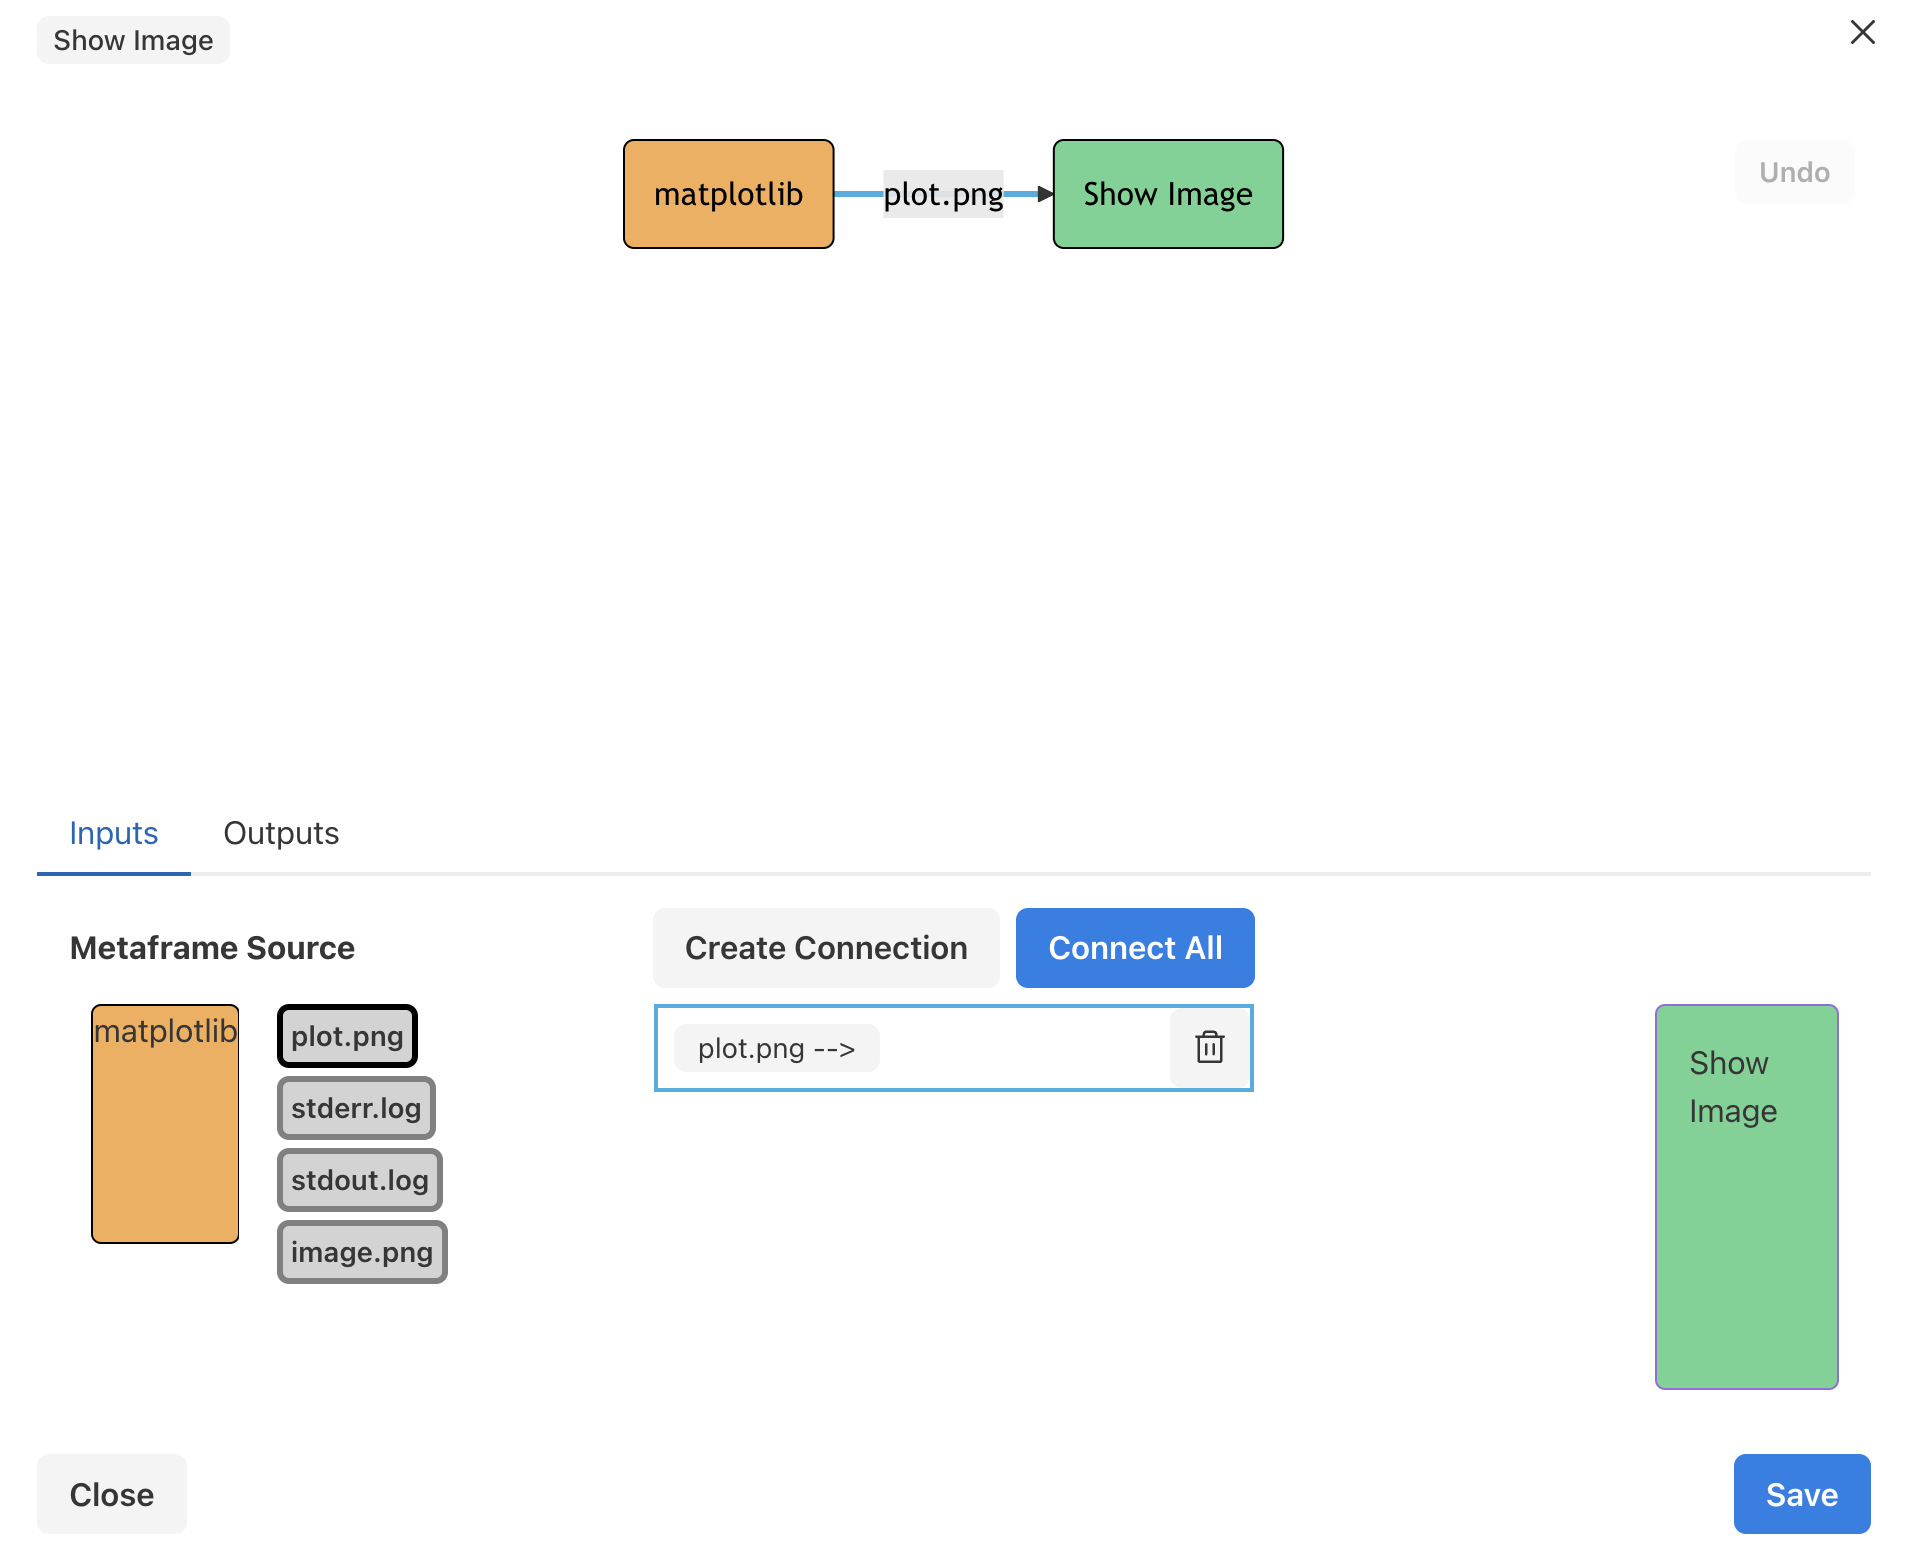
- In the connection interface, click on the
plot.pngoutput from the Python metaframe. This creates a connection from the Python container to the image viewer, automatically sending theplot.pngfile. For more detail about connections click here.
Step 9: Save the Connection
Click Save to finalize the data connection.
Step 10: View Your Plot
You should now see the plot displayed in your "Show Image" metaframe. The visualization shows the data points you generated with your Python code.
Congratulations!
You've successfully created a metapage that:
- Runs Python code in a containerized environment
- Generates a data visualization
- Displays the output in a viewer metaframe
This demonstrates how Metapages allow you to create interactive, computational workflows directly in the browser.
Next Steps
Try modifying the Python code to create different visualizations or perform different data analyses. You could:
- Change the type of plot (bar chart, line plot, etc.)
- Generate different kinds of data
- Add more complex data processing steps